- Cama-i, quyana tailuci!
- (Central Yup’ik)
- "Greetings, thank you for coming!"
Alaska Education Data Dashboards
These dashboards are part of the department's Operational Data Warehouse initiative to improve how education data is collected, organized, and shared with the public. This initiative is building a more consistent way to bring data together so districts, educators, department staff, and policymakers can access clearer information more quickly. The dashboards below are early results of that work. They provide statewide and district-level views of key education measures, with more dashboards to be added as additional data is brought into the warehouse.
We welcome feedback as this work continues to grow.
General Statewide Longitudinal - Student enrollment, spending per pupil, full-time equivalent staffing, graduation rates, dropout rates, and attendance rates. Select multiple districts, schools, student groups, and years to explore statewide education data.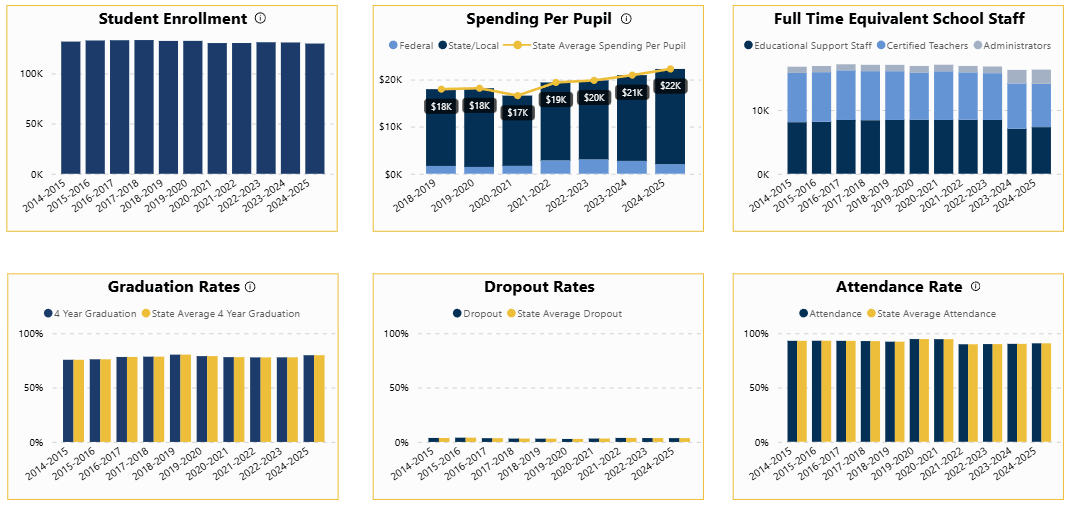
State Summative Assessments - Explore results from summative English/Language Arts, Mathematics, and Science assessments including trends over time, grade level, and by student demographic groups.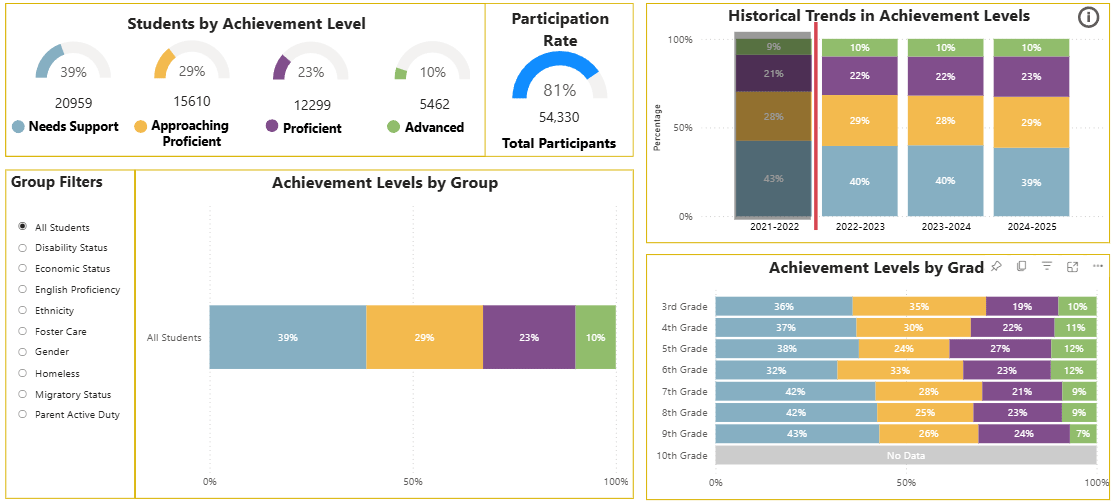
First Day Vacancy - Teaching position vacancy rates by percent or count over time, including by teaching assignment, assignment category, region, and vacancy reason. Select multiple districts or schools.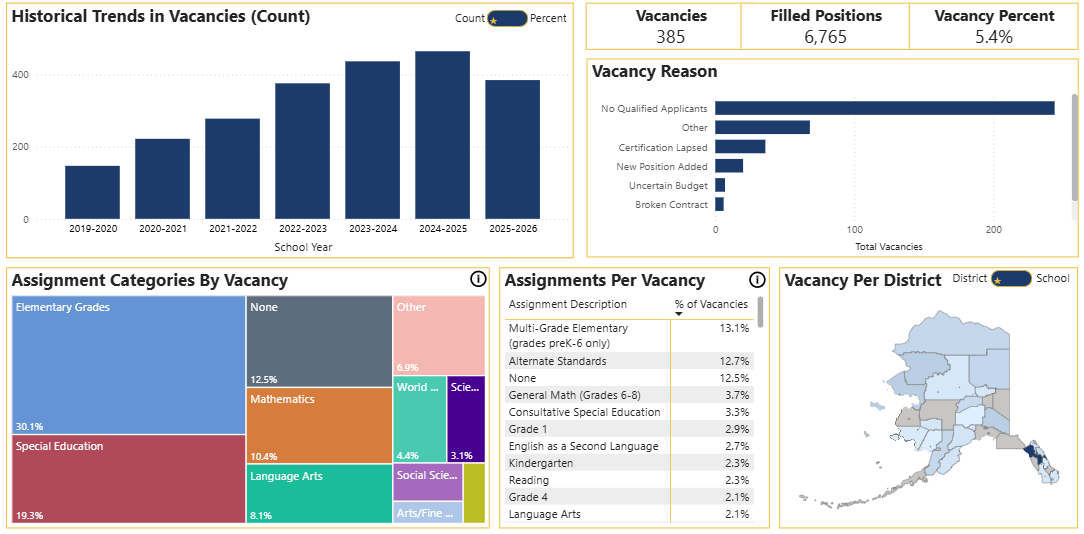
Advanced and Proficient Comparison - Explore advanced and proficient percentages over years between districts and standardized assessment, displayed geographically or by selecting a district.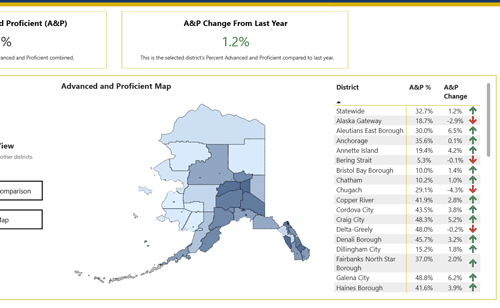
Tips for Using These Dashboards
-
Start with one question. Choose a topic, year, district, school, or student group to begin. The dashboards work best when you narrow the view step by step.
-
Click any chart to filter the rest of the page. Selecting a bar, map area, or data point updates the other visuals so you can explore the data from different angles.
-
Select more than one item when needed. Hold down Command (Mac) or Control (Windows) to choose multiple districts, schools, years, or student groups. Note that in some dashboards, to maintain data suppression for small schools, multi-select is not enabled.
-
Use filters to compare results. You can compare performance across years, locations, and student groups to better understand patterns and changes over time.
-
Reset at any time. Use the Reset button to return the dashboard to its default view.
-
Keep context in mind. These dashboards are designed to support exploration. Results may look different depending on the filters and years selected.
-
Share feedback with DEED. If something is unclear, or if there is a view that would be useful, please email eed.tech@alaska.gov.